
The MSSP report gives you a consolidated view of peak usage per product across all of your customers,and shows what you have been invoiced for each reporting period. A reporting period runs from the 26thof the previous month to the 25th of the reporting month.
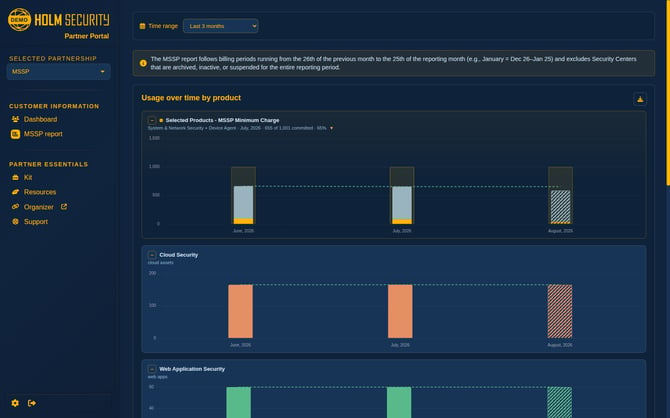
Invoiced months and the current month
The report separates what has already been billed from what is still accruing.
-
Closed months show exactly what was invoiced. The figures come from the approved report for that month, so what you see is what you were charged — the report never recalculates a closed month.
-
The current month is a projection. It carries a PROJECTED label and a note saying it has not been invoiced yet. Its figures update as usage is recorded, and its bars are drawn with a hatched pattern so you can tell at a glance that they are not settled.
Choosing the period
Use Time range to switch between the last 3 and the last 6 reporting months. The report reloads as soon as you choose — there is no Apply button.

Usage over time by product
Each product gets its own graph, so you can read one product without the others competing for the same axis. Every graph can be collapsed with the − control beside its title, and stays collapsed while you work.
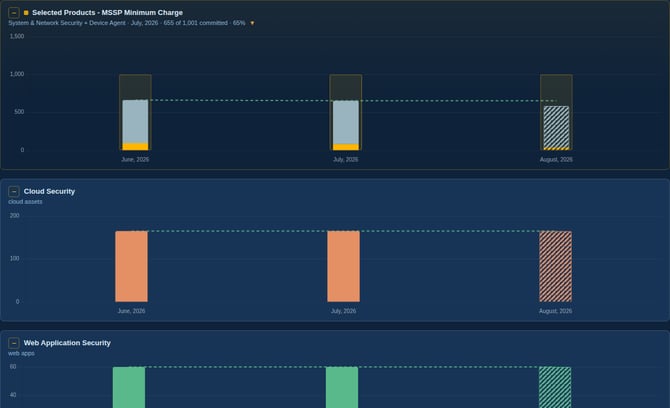
Peak usage explained. If a customer scanned 14 IPs during a period and later reduced that to 10,the peak for that customer in that period is still 14. The report bills on peaks, so a temporary increase counts for the whole period.
Your committed minimum
If your agreement includes a minimum commitment, it appears as its own graph, with the products it covers stacked inside it. The subtitle tells you which products it spans and how much of the commitment has been drawn down — for example *655 of 1,001 committed · 65%*, with an arrow showing whether you are below or above it.
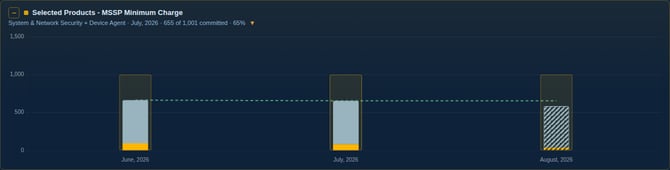
The unit follows your agreement:
-
If your minimum is an asset commitment, the graph is drawn in assets and the drawdown is counted in assets.
-
If your minimum is a monetary commitment, the graph is drawn in your invoicing currency and the drawdown is the value the covered products would otherwise have cost.
Which customers make up a figure
Click any bar to see the customers behind it. The breakdown names every contributing company and itsshare, and the rows add up to the total shown above them.
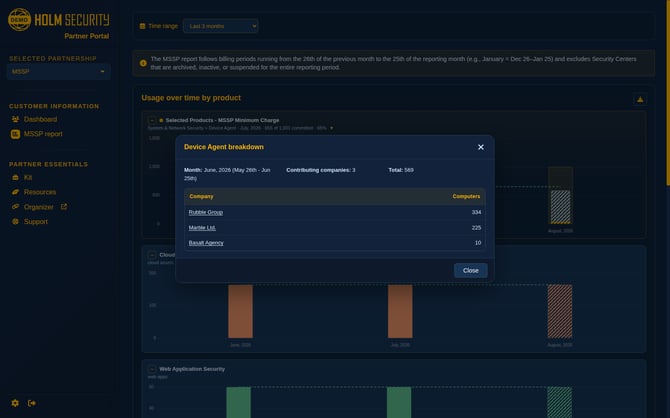
Click a company name to open that customer directly.
Occasionally a month's figure cannot be split by customer — this happens when the approved figure for that month cannot be reproduced from the recorded usage, for example after the amount was adjusted manually. In that case the report tells you so plainly and still shows the invoiced total, rather than presenting a split that would not add up. If you need the detail for such a month, contact your partner manager.
Monthly detail
Beneath the graphs, each month is listed charge by charge, exactly as it appears on your invoice.
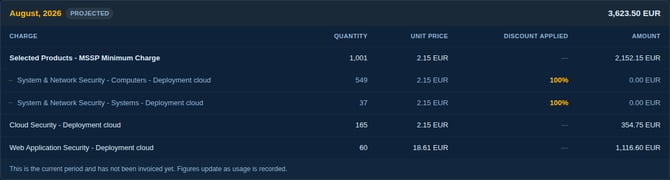
The columns are:
| Column | What it shows |
| Charge | The product or charge as it appears on the invoice |
| Quantity | The peak usage, or the committed quantity for a minimum charge |
| Unit price | Your contracted price per unit |
| Discount applied | The discount on that line — 100% means the line is already paid for by a minimum above it |
| Amount | What the line contributes to the month |
Reading a committed minimum. The minimum charge heads its group, and the products it covers are indented beneath it at 100% discount and 0.00. That is not a missing charge: the minimum above already pays for them, and they are listed so you can see the usage the commitment absorbed.
Reading a per-product minimum. Where a product has its own minimum, the minimum charge is listed first and the usage above it is indented beneath, tagged (above minimum charge). The two together are your total usage for that product.
The month total is shown beside the month name.
Export to Excel
The download icon in the top-right corner of the graphs exports a month in full.
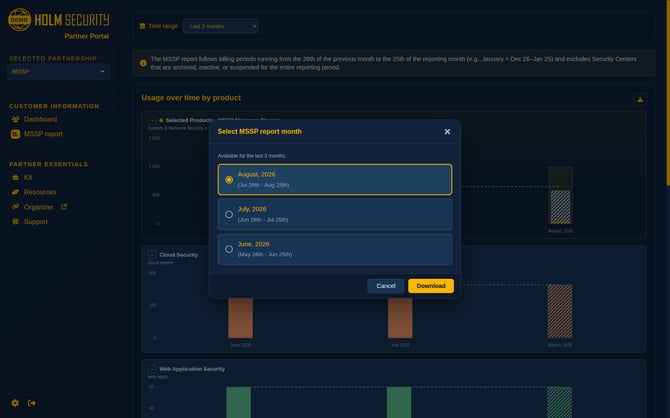
Choose the reporting month you want — the current one, or either of the two before it. The workbook contains every charge for that month with the same quantities, unit prices, discounts and amounts you see on screen, and beneath each charge the customers that make it up.